Customer: FTI Consulting / Vifor Pharma
The healthcare sector has enormous amounts of data research around any given subject, sometimes data is better understood as a graphic, than to use hundreds of words
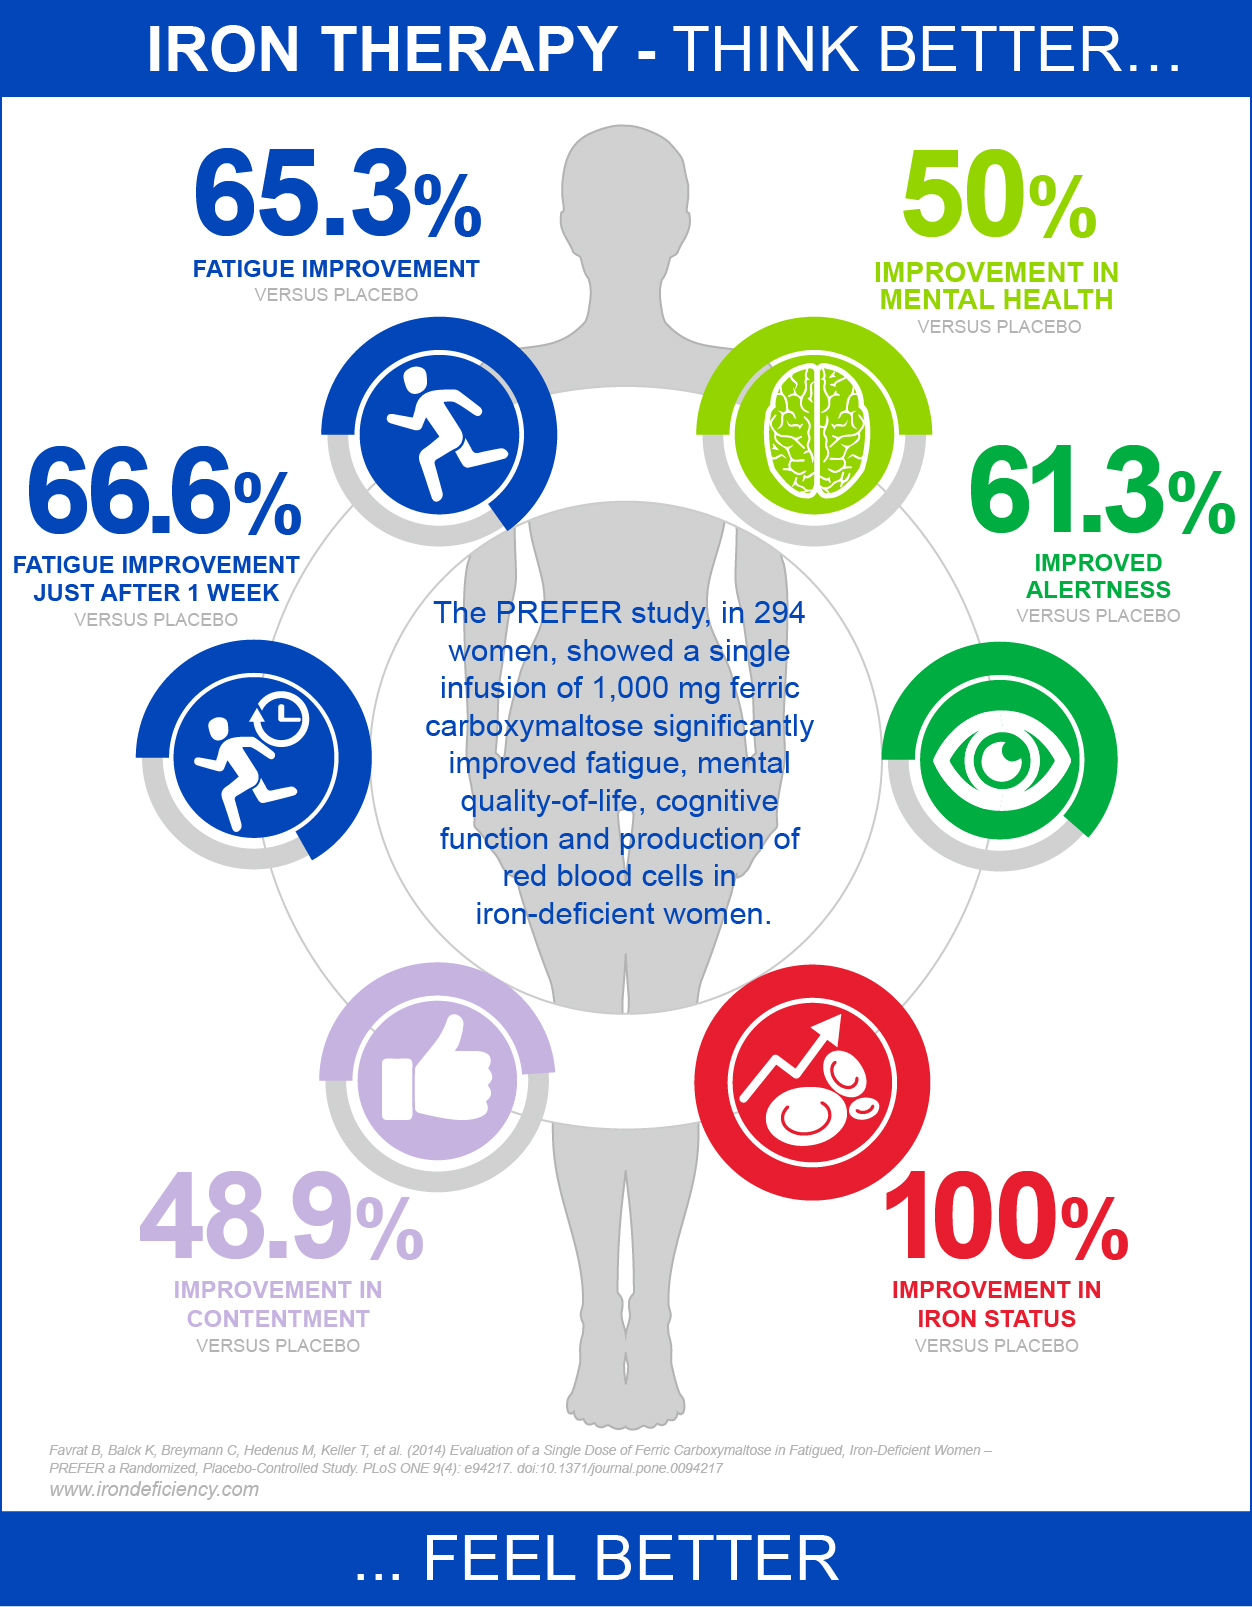
Our brief was to design and create an infographic clearly demonstrating the circular effects of iron deficiency in women on an iron deficiency website for a pharmaceutical company.
Working in close liaison with a London consultancy who specialise in the healthcare sector, we created the infographic, using existing colours from the pharmaceutical company’s corporate guidelines and previous graphic styles to ensure our infographics fitted seamlessly into their website, maintaining brand consistency.
At SBM we are skilled at dealing with design constraints of company guidelines and understand the importance of brand image, colour and consistency. We ensure our work is exactly suited to our client’s needs and always satisfies a company’s culture.
We love creating infographics, if you have data you want turned into graphics for your website, get in touch on 01379 676720. Let us visually spread your message.